

Current analysis of Bitcoin exchange order books suggests an impending liquidity showdown as BTC consolidates within a narrow range. Traders are warned of possible losses due to volatile price movements.
Recent data from CoinGlass highlights optimal conditions for a new wave of “liquidity grabs,” potentially reaching $111,000.
Liquidity Set to Challenge BTC Prices
Bitcoin remains steady at around $105,000 following a swift recovery from recent multi-week lows, aided by a ceasefire in the Middle East. However, as BTC price action stabilizes, liquidity is increasing on both sides of the current spot price. This buildup often leads to a sharp move aimed at neutralizing the excess liquidity, a phenomenon known as a liquidity “grab.”
“I wouldn’t be surprised to see $BTC push a little higher into the 107K’s before pulling back and taking the liquidity below 105-104K with a quick wick,” trader and analyst Mark Cullen told X followers on Wednesday.
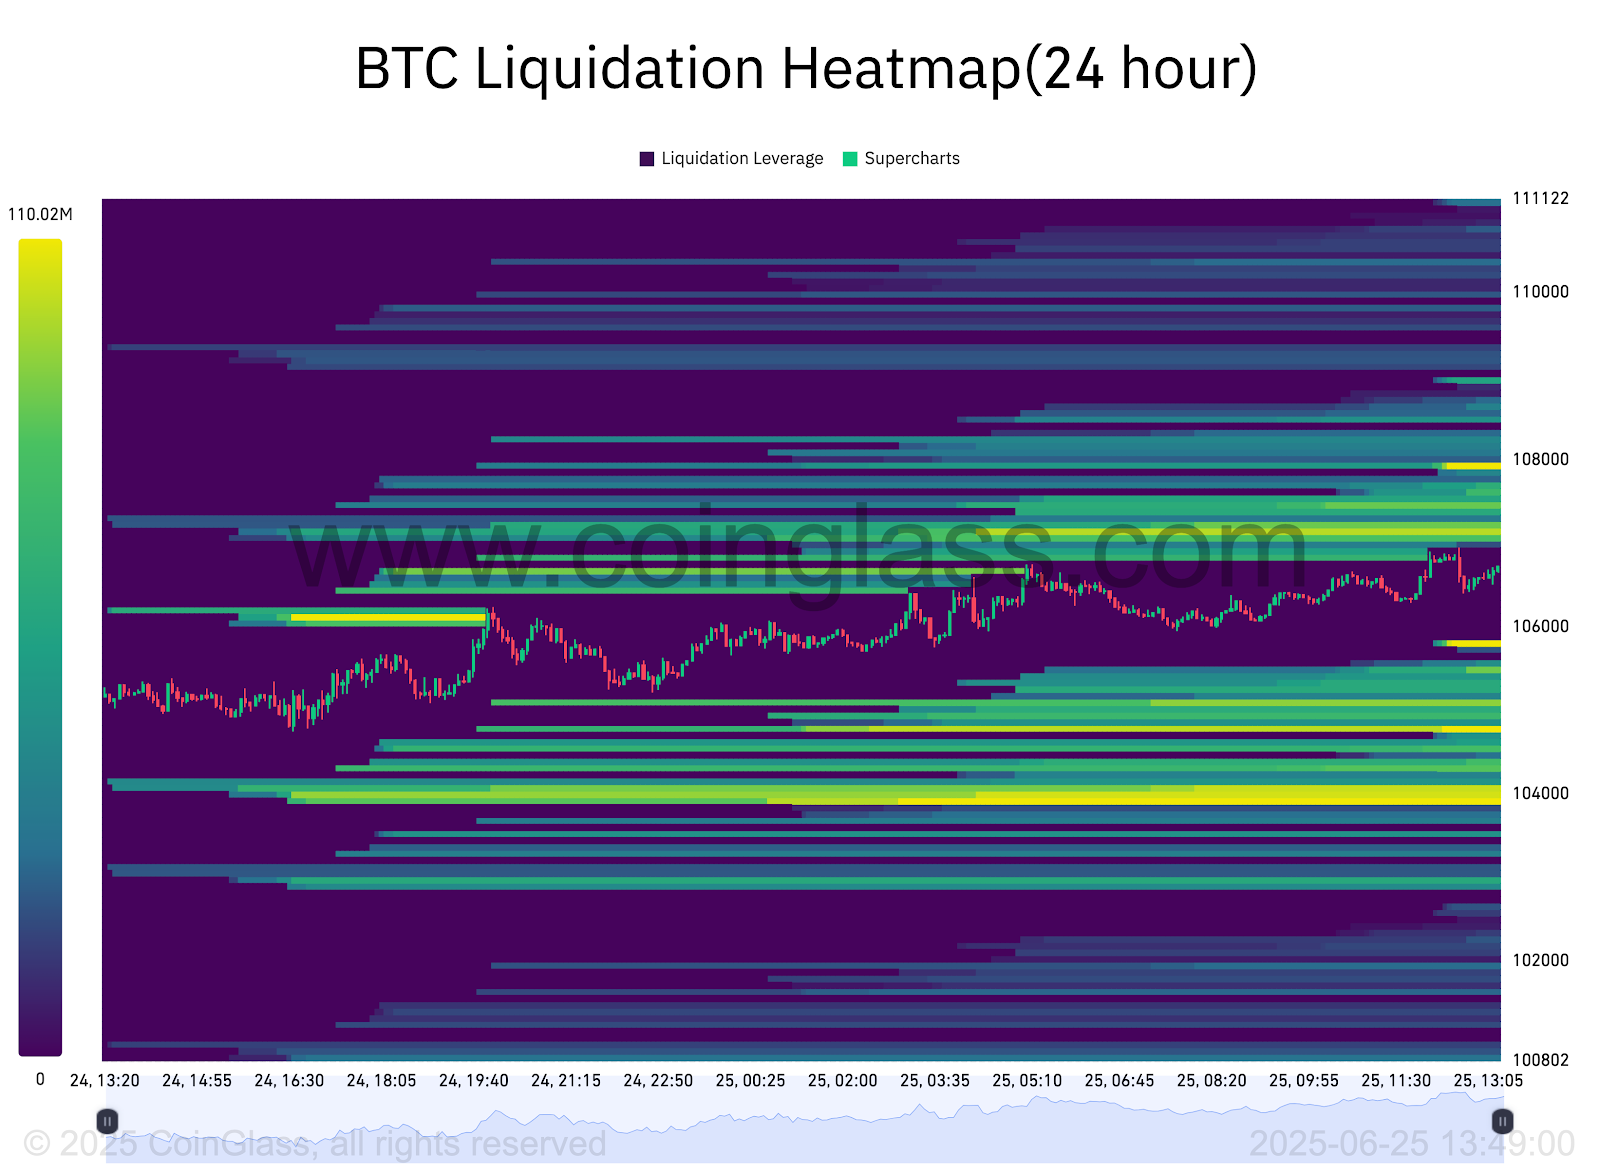
BTC 24-hour liquidation heatmap. Source: CoinGlass
Cullen shared CoinGlass liquidity data, which identifies critical price levels where liquidation events are likely to happen. As of now, $108,000 is emerging as a target due to the replenishment of liquidity near all-time highs.
Looking at the broader picture, fellow trader Jelle observed that the liquidity above current all-time highs has become more substantial compared to that below the price level, raising the likelihood of a upward movement. He remarked, “$111,000 seems poised to be reached next,” while commenting on the CoinGlass data.
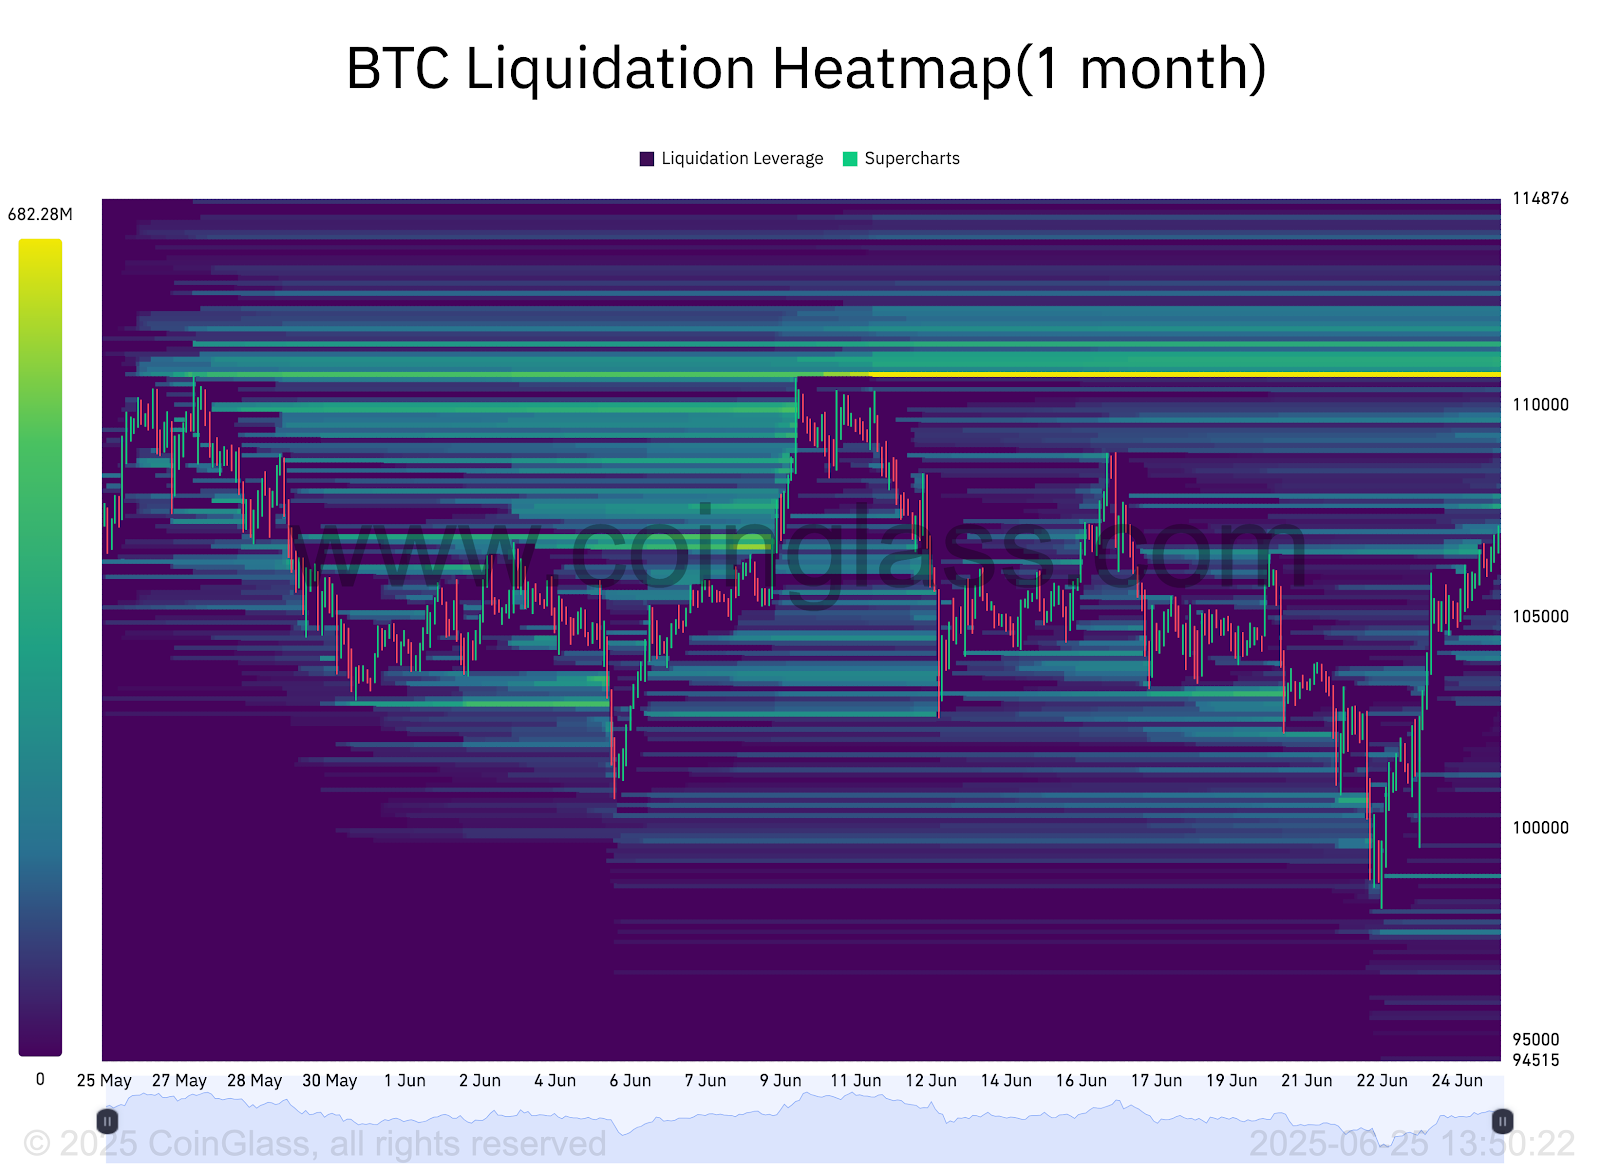
BTC 1-month liquidation heatmap. Source: CoinGlass
Trader Skew identified $103,000 as a “pivotal” level in the event of a downside liquidity grab. His latest analysis on X noted, “The market is currently quite neutral in terms of positioning, with longs targeting higher prices and shorts being opened as hedges.” He added, “The more liquidity attracted here, the stronger the reaction will be.”
Additionally, analysts are monitoring key liquidity conditions as they anticipate volatility ahead of important US macroeconomic data and the monthly candle close.
As Cointelegraph reported Friday will see the release of the Federal Reserve’s “preferred” inflation gauge amid signs that officials are open to an interest-rate cut next month.
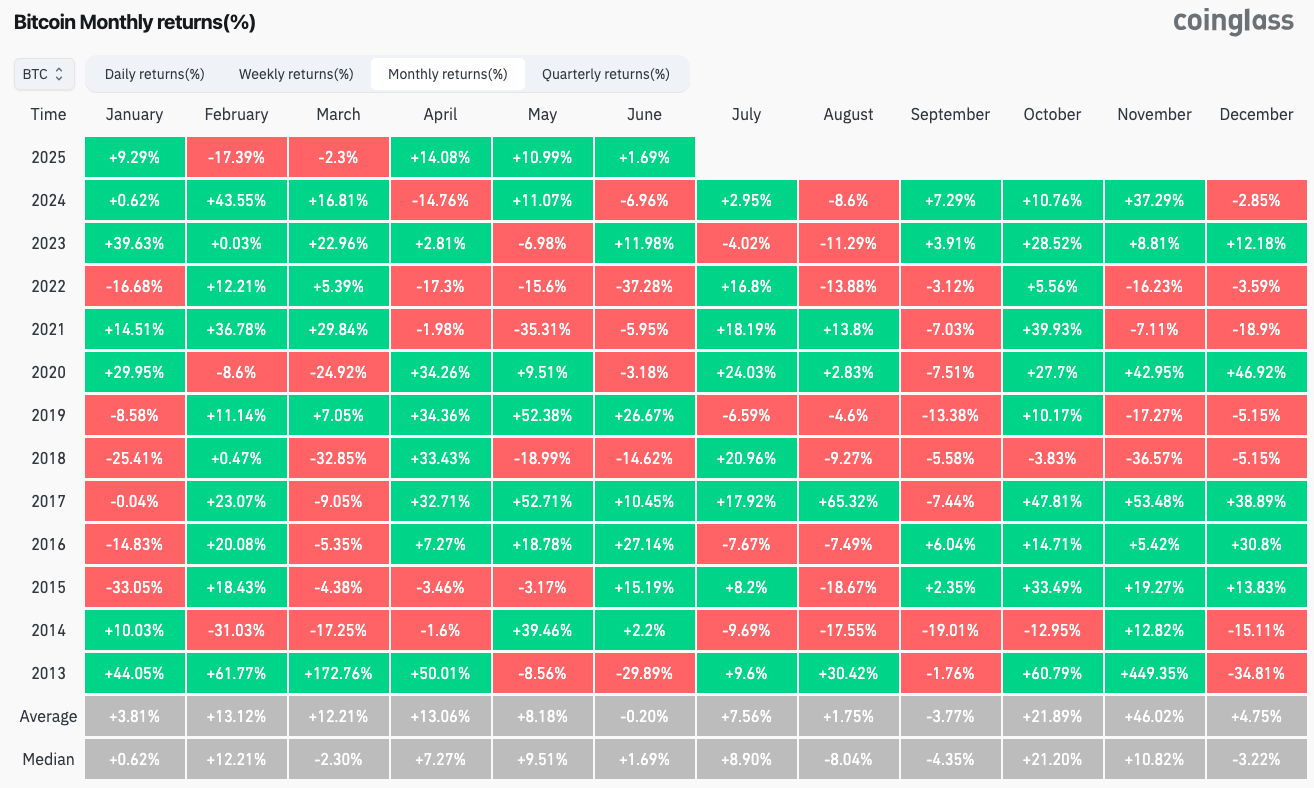
BTC/USD monthly returns (screenshot). Source: CoinGlass
With BTC/USD overall up 1.7% in June, the exact monthly close level will be telling, trader and analyst Rekt Capital said.
“A Monthly Close above ~$102400 (blue) would confirm the Monthly Range breakout,” he wrote on X alongside an explanatory chart on Tuesday.
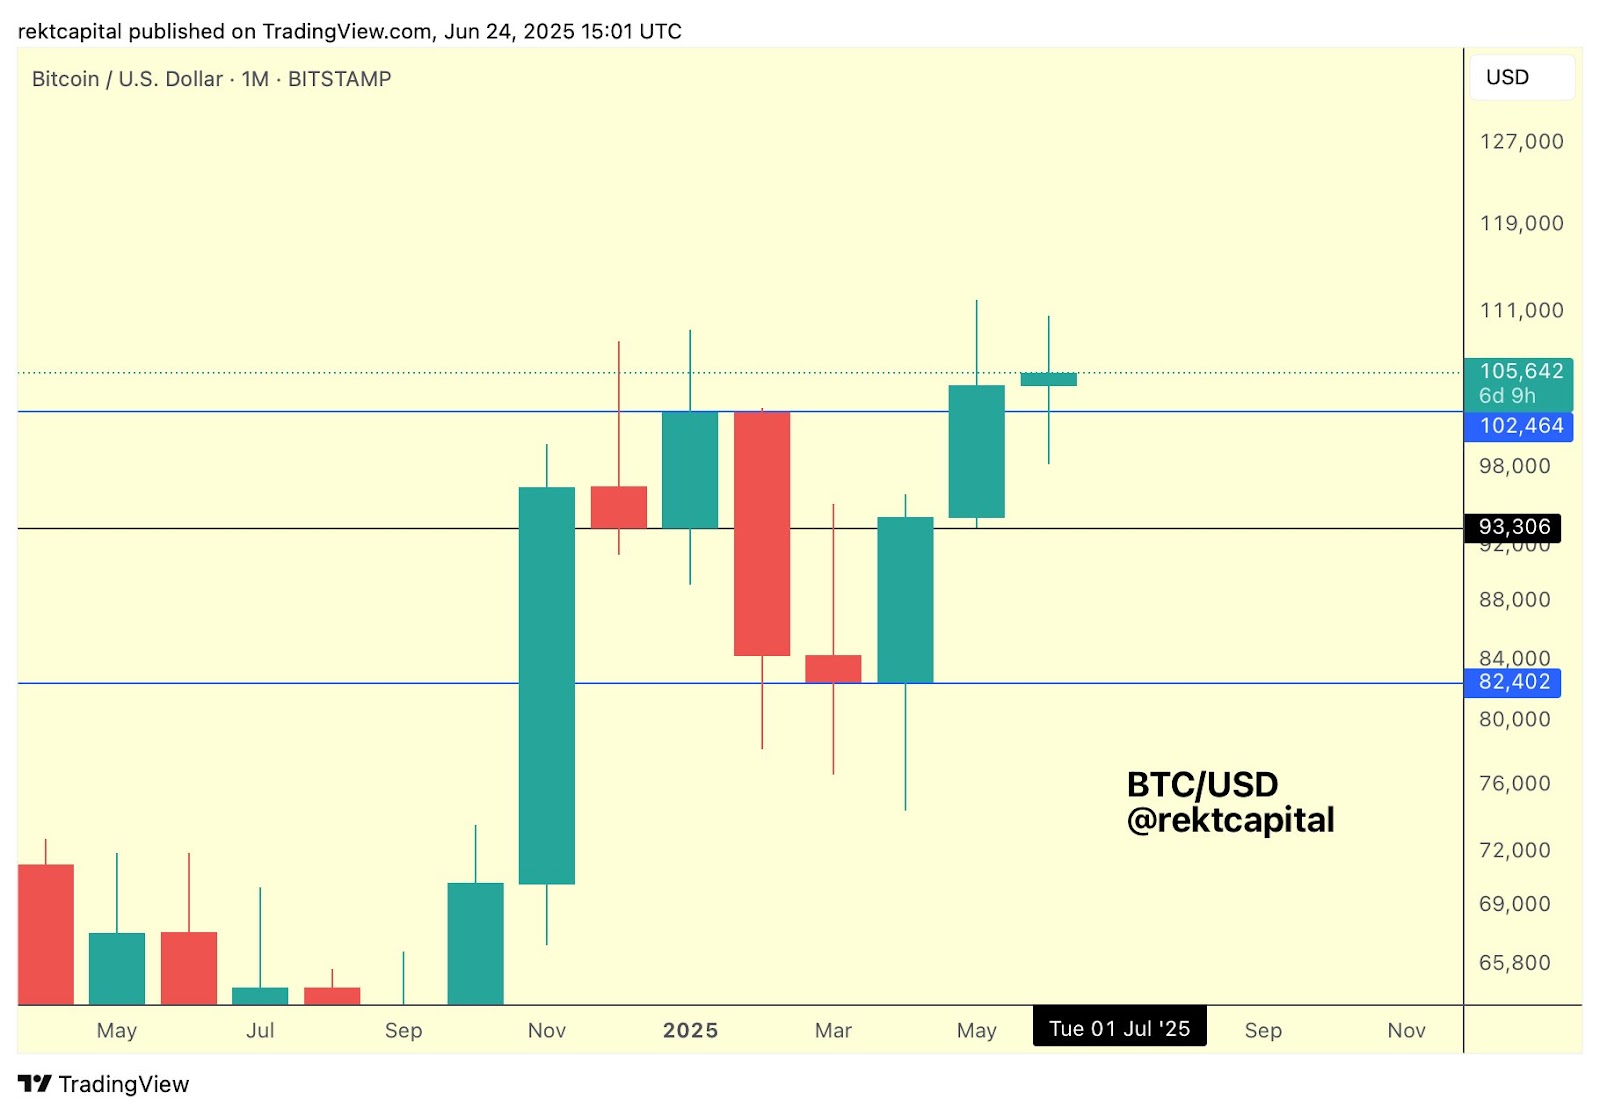
BTC/USD 1-month chart. Source: Rekt Capital/X
Source: Cointelegraph Edited by Bernie S.