

As the weekly close approaches, Bitcoin and Ether traders are targeting significant price milestones, with a resistance trend line currently hindering Bitcoin’s ascent to all-time highs.
Bitcoin hovered around $118,500 as Sunday’s weekly close neared, with traders on the lookout for a potential breakout in BTC prices.
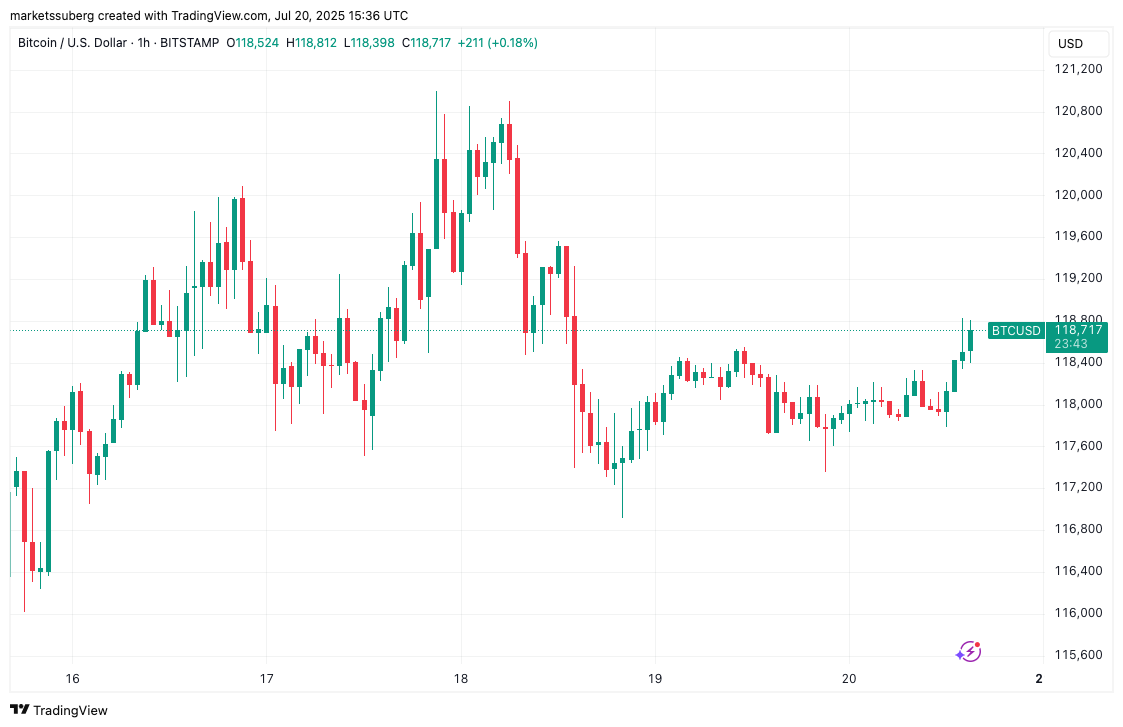
BTC/USD 1-hour chart. Source: Cointelegraph/TradingView
Traders Predict Bitcoin Could Break Through $125,000
Data from Cointelegraph Markets Pro and TradingView indicated that BTC/USD was on the rise after dipping below $117,000 on Friday. The pair managed to hold onto most of its gains over the week, remaining shy of new all-time highs amidst a phase of consolidation.
Traders are now focused on a resistance trend line that could impede Bitcoin’s return to price discovery above $123,000. “BTC is gearing up for a significant move,” popular trader Marcus Corvinus shared with his followers on X. He noted that Bitcoin is operating within a triangle pattern, maintaining strong support around $116,000 to $117,000. “Currently, it’s moving sideways, but that won’t last long.”
Corvinus, sharing a chart illustrating the trend line, predicted that a breakout could push BTC/USDT to $125,000. He cautioned that if it falls below support, prices might drop to $111,000 or lower. “This triangle is nearing a breakout or breakdown, so stay alert. The next big move is imminent.”
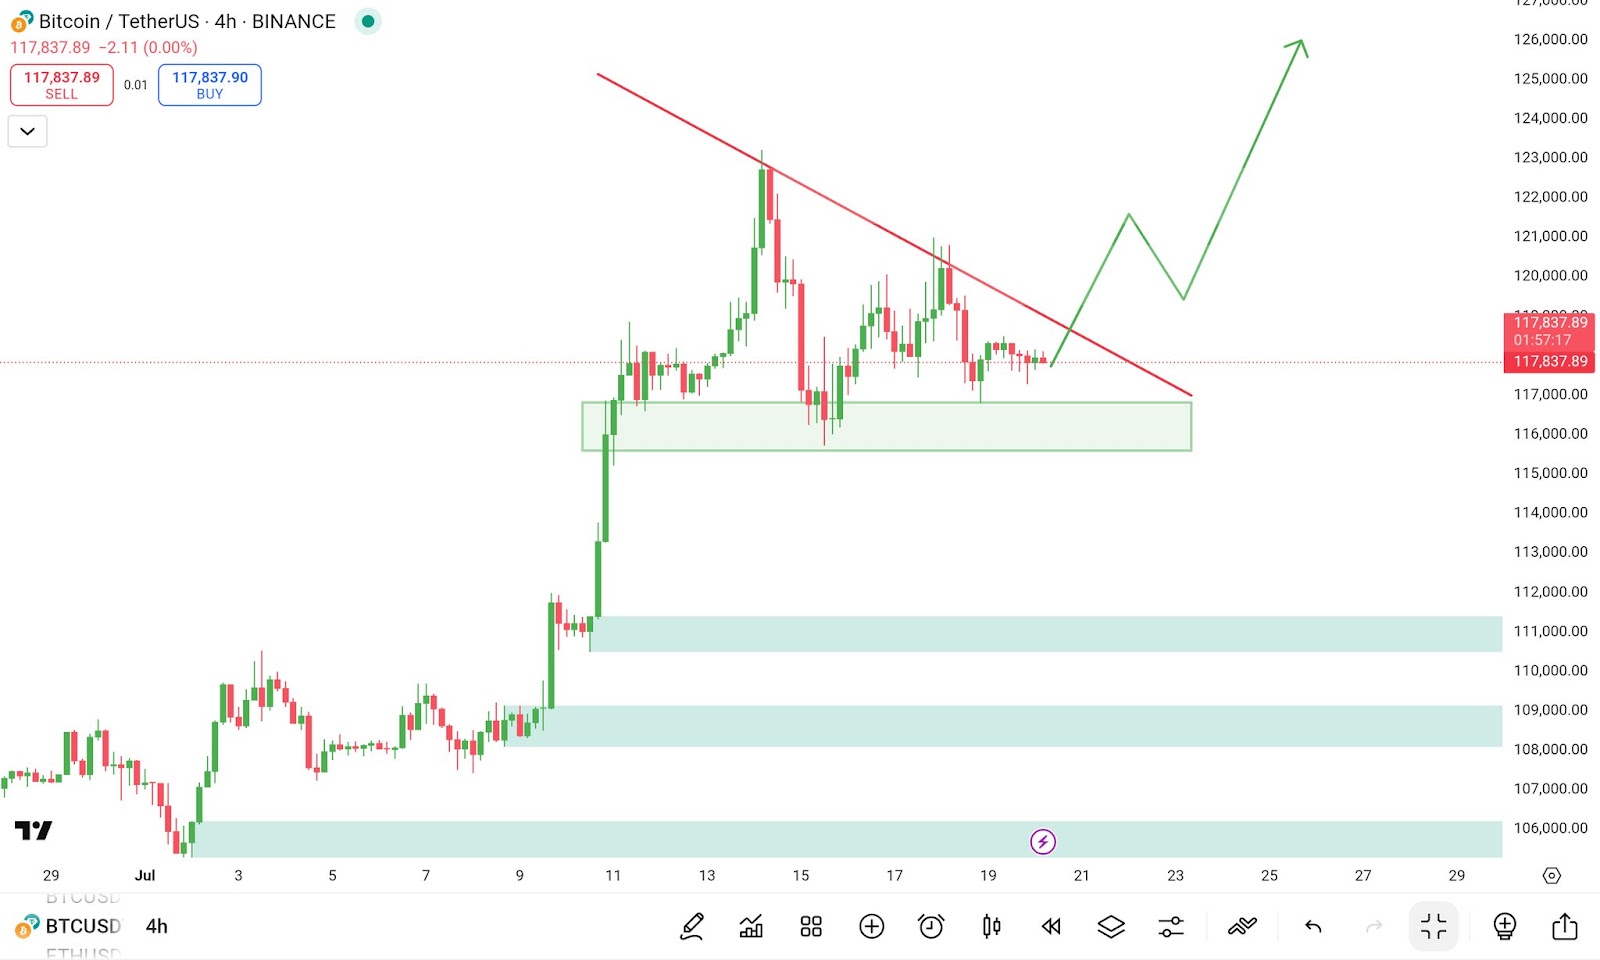
BTC?USDT 4-hour chart. Source: Marcus Corvinus/X
Similarly, well-known trader Rekt Capital observed comparable patterns on daily time frames. “Bitcoin is still within the range, and this consolidation is enabling further capital flow into altcoins,” he remarked on his chart. “If it breaks the Lower High within the range, Bitcoin could challenge the Range High for another breakout attempt.”
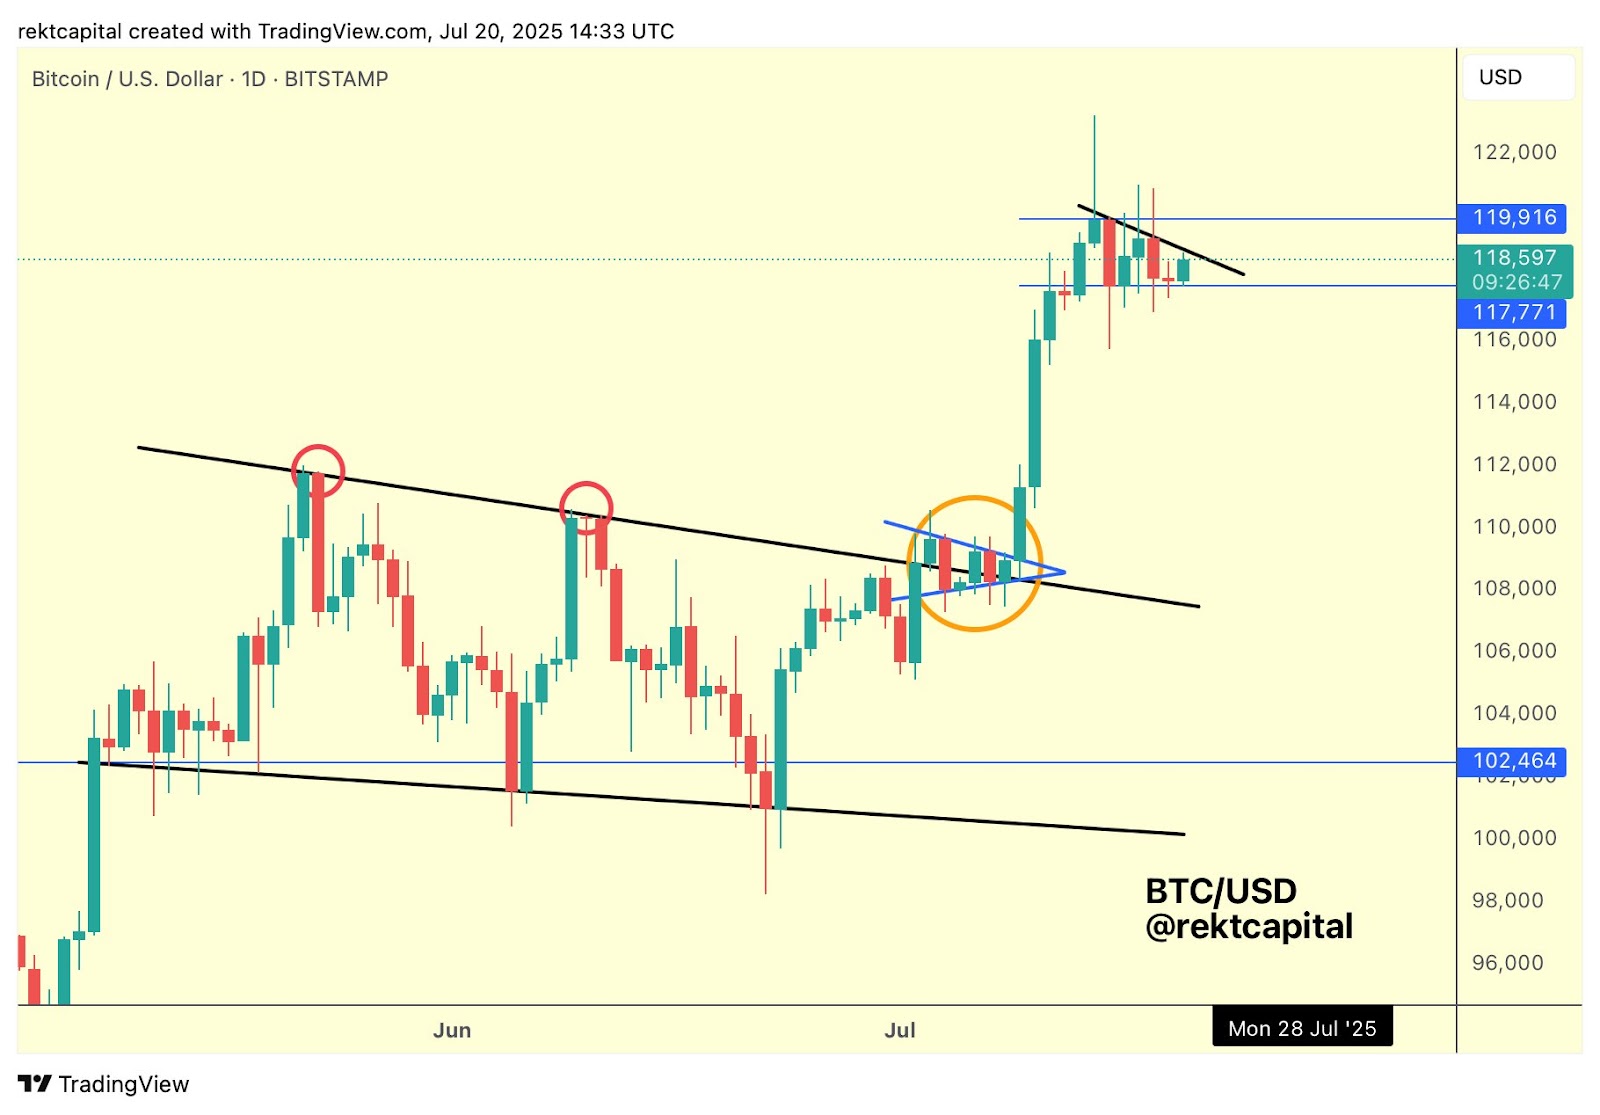
BTC/USD 1-day chart. Source: Rekt Capital/X
Ethereum Soars to 7-Month Peak Ahead of Weekly Close
Meanwhile, Ethereum hit a seven-month high as Bitcoin consolidated. As noted by Cointelegraph, altcoins are regaining attention, especially Ethereum and XRP, both attracting ambitious price forecasts. “Ethereum has realigned with its $2,200-$3,900 macro range,” Rekt Capital summarized in a post that included a chart dating back to late 2023..
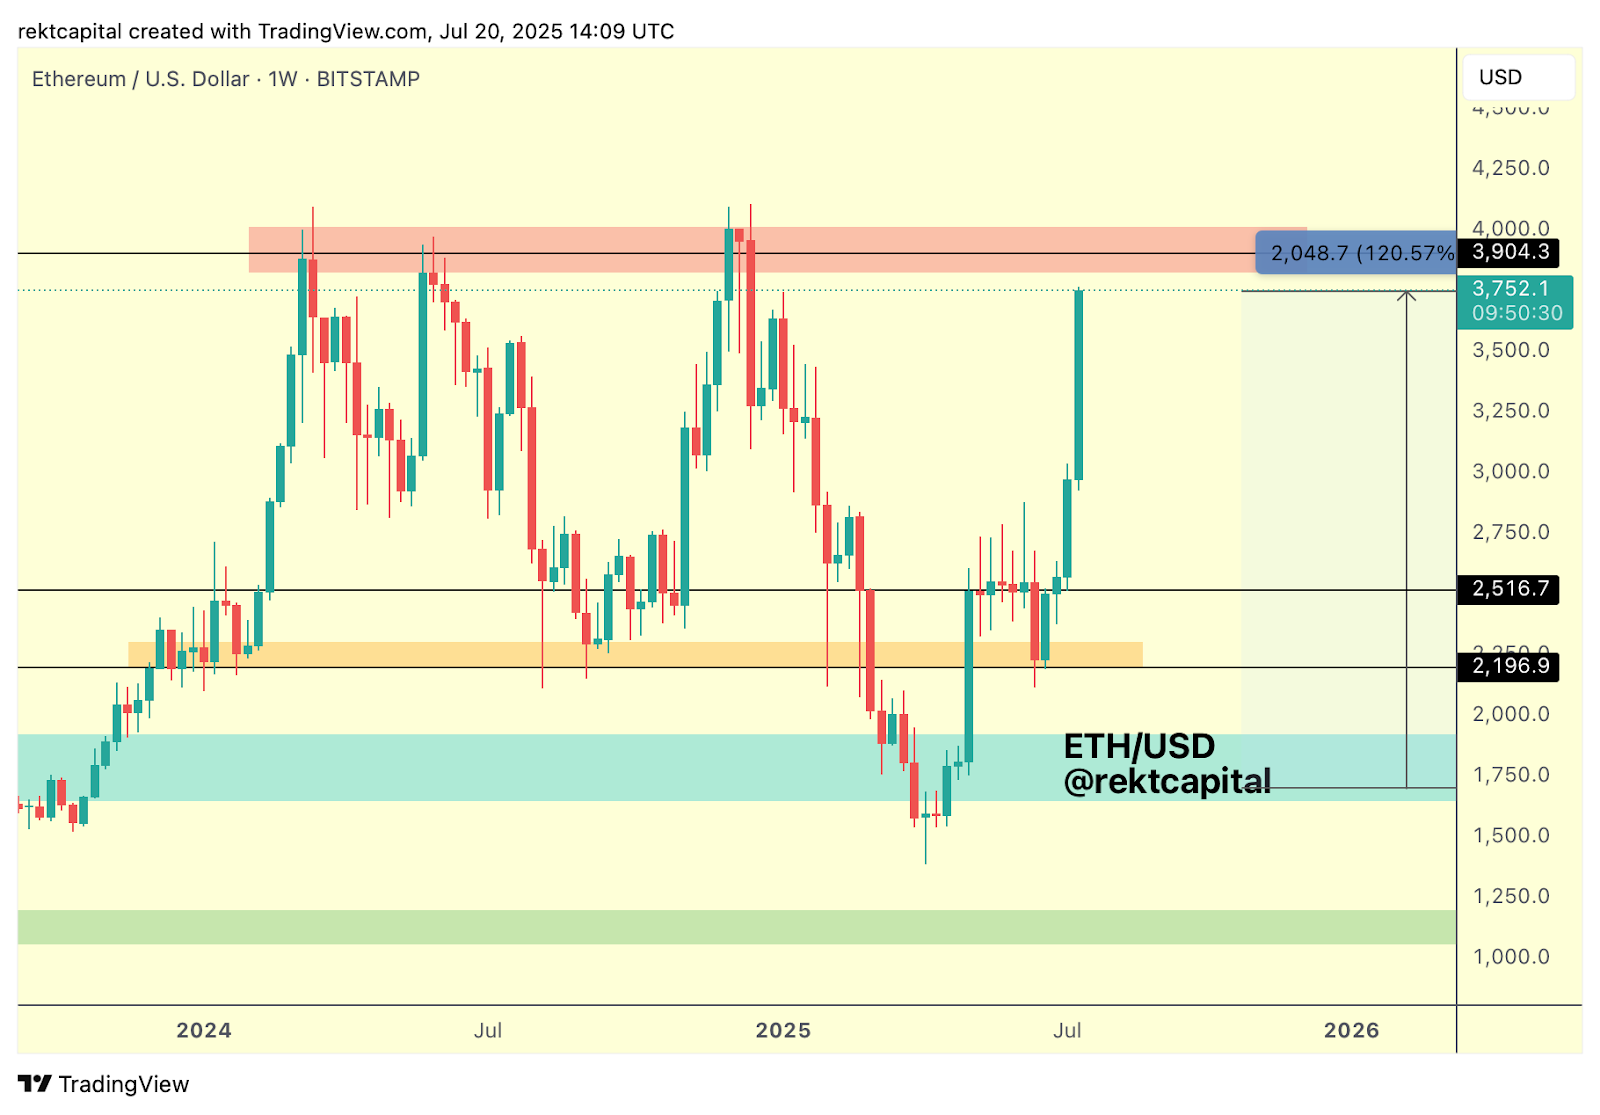
ETH/USD 1-week chart. Source: Rekt Capital/X
Crypto trader and analyst Michaël van de Poppe described the rebound in ETH/USD as “absolutely phenomenal.” He pointed out that Ethereum has returned to the highs of December 2024, suggesting significant upside potential remains. “However, many altcoins are still down 50-80% from those December highs, indicating substantial room for growth.”
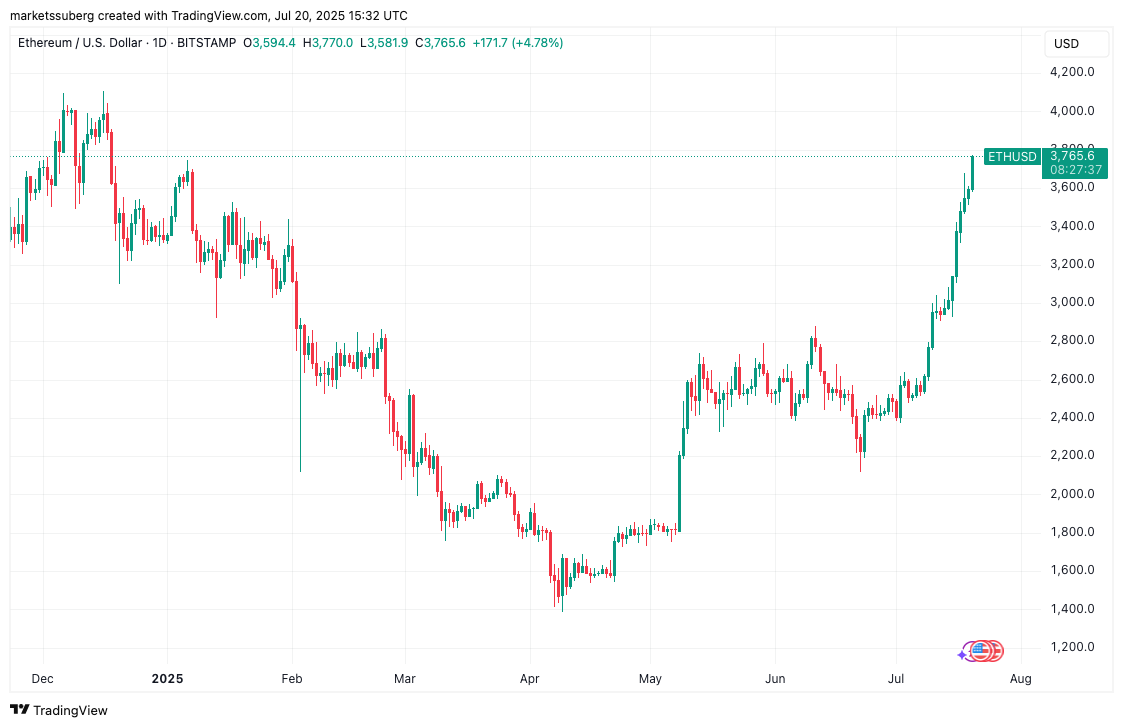
ETH/USD 1-day chart. Source: Cointelegraph/TradingView
On Sunday, ETH/USD traded above $3,750 for the first time since December 18, 2024.
Source: Cointelegraph Editor: Bernie S.